


US ISM Manufacturing PMI is expected to show strong factory activity in July
- The US ISM Manufacturing PMI is seen improving to 54 in July from 53.3 in June.
- The ISM Prices Paid component is expected to have eased for the third consecutive month.
- The US Dollar trades at seven-week lows against the Euro, weighed by a positive risk sentiment.
Investors are attentive to the US Institute for Supply Management (ISM) on Monday, as it releases July’s Manufacturing Purchasing Managers Index (PMI). This is one of the most closely followed indicators of business activity in the US manufacturing sector, considered a key indicator for economic growth.
The market consensus anticipates an improvement to 54 in the headline indicator, from the 53.3 reading seen in June. If these figures are confirmed, they would match May’s reading, which was the strongest performance of the last four years, in an index showing expansion at levels above 50 and contraction otherwise.
Apart from that, the US ISM Prices Paid component is expected to have eased to 70.3, from 73 in June and 82.1 in May. This is the lowest inflation reading since the war between the US and Iran started, back in February, but still significantly above the 60 average in the six months preceding the war.
What to expect from the US ISM Manufacturing PMI report?
If the market consensus is met, it will confirm the resilience of the US manufacturing sector amid uncertainty surrounding the conflict in the Middle East and high energy prices stemming from it.
These figures are likely to revive the rhetoric of US economic exceptionalism and ease concerns about the slowdown of the second quarter’s US Gross Domestic Product (GDP) released last week. The market, however, will be very attentive to the Employment sub-index for a more complete view.
The US ISM Manufacturing Employment Index has been improving in the last two readings, but it has remained within contractionary levels for most of the last four years. In that sense, a strong PMI release, coupled with an expansion in employment and with inflation at relatively high levels, is likely to improve investors’ confidence about the US economy and strengthen the case for some Federal Reserve (Fed) monetary tightening this year, providing some support to the US Dollar.
The positive impact on the Greenback, however, is likely to be limited. The US Dollar Index (DXY), which measures the value of the USD against a basket of currencies, is languishing at seven-week lows amid a mix of risk-appetite triggered by the pause in hostilities in Iran and the sharp USD/JPY reversal following an exceptional US-Japan coordinated FX intervention to shore up the Japanese Yen.
When will the US ISM Manufacturing PMI report be released, and how could it affect EUR/USD?
The US ISM Manufacturing PMI report is scheduled for release at 14:00 GMT on Monday.
The Euro (EUR) consolidates gains on Monday, trading at the 1.1525 area against the US Dollar at the time of writing, standing at its highest levels since mid-June. In that sense, positive data might put a lid on Euro appreciation, but it is unlikely to reverse the current bullish trend unless the risk mood changes substantially
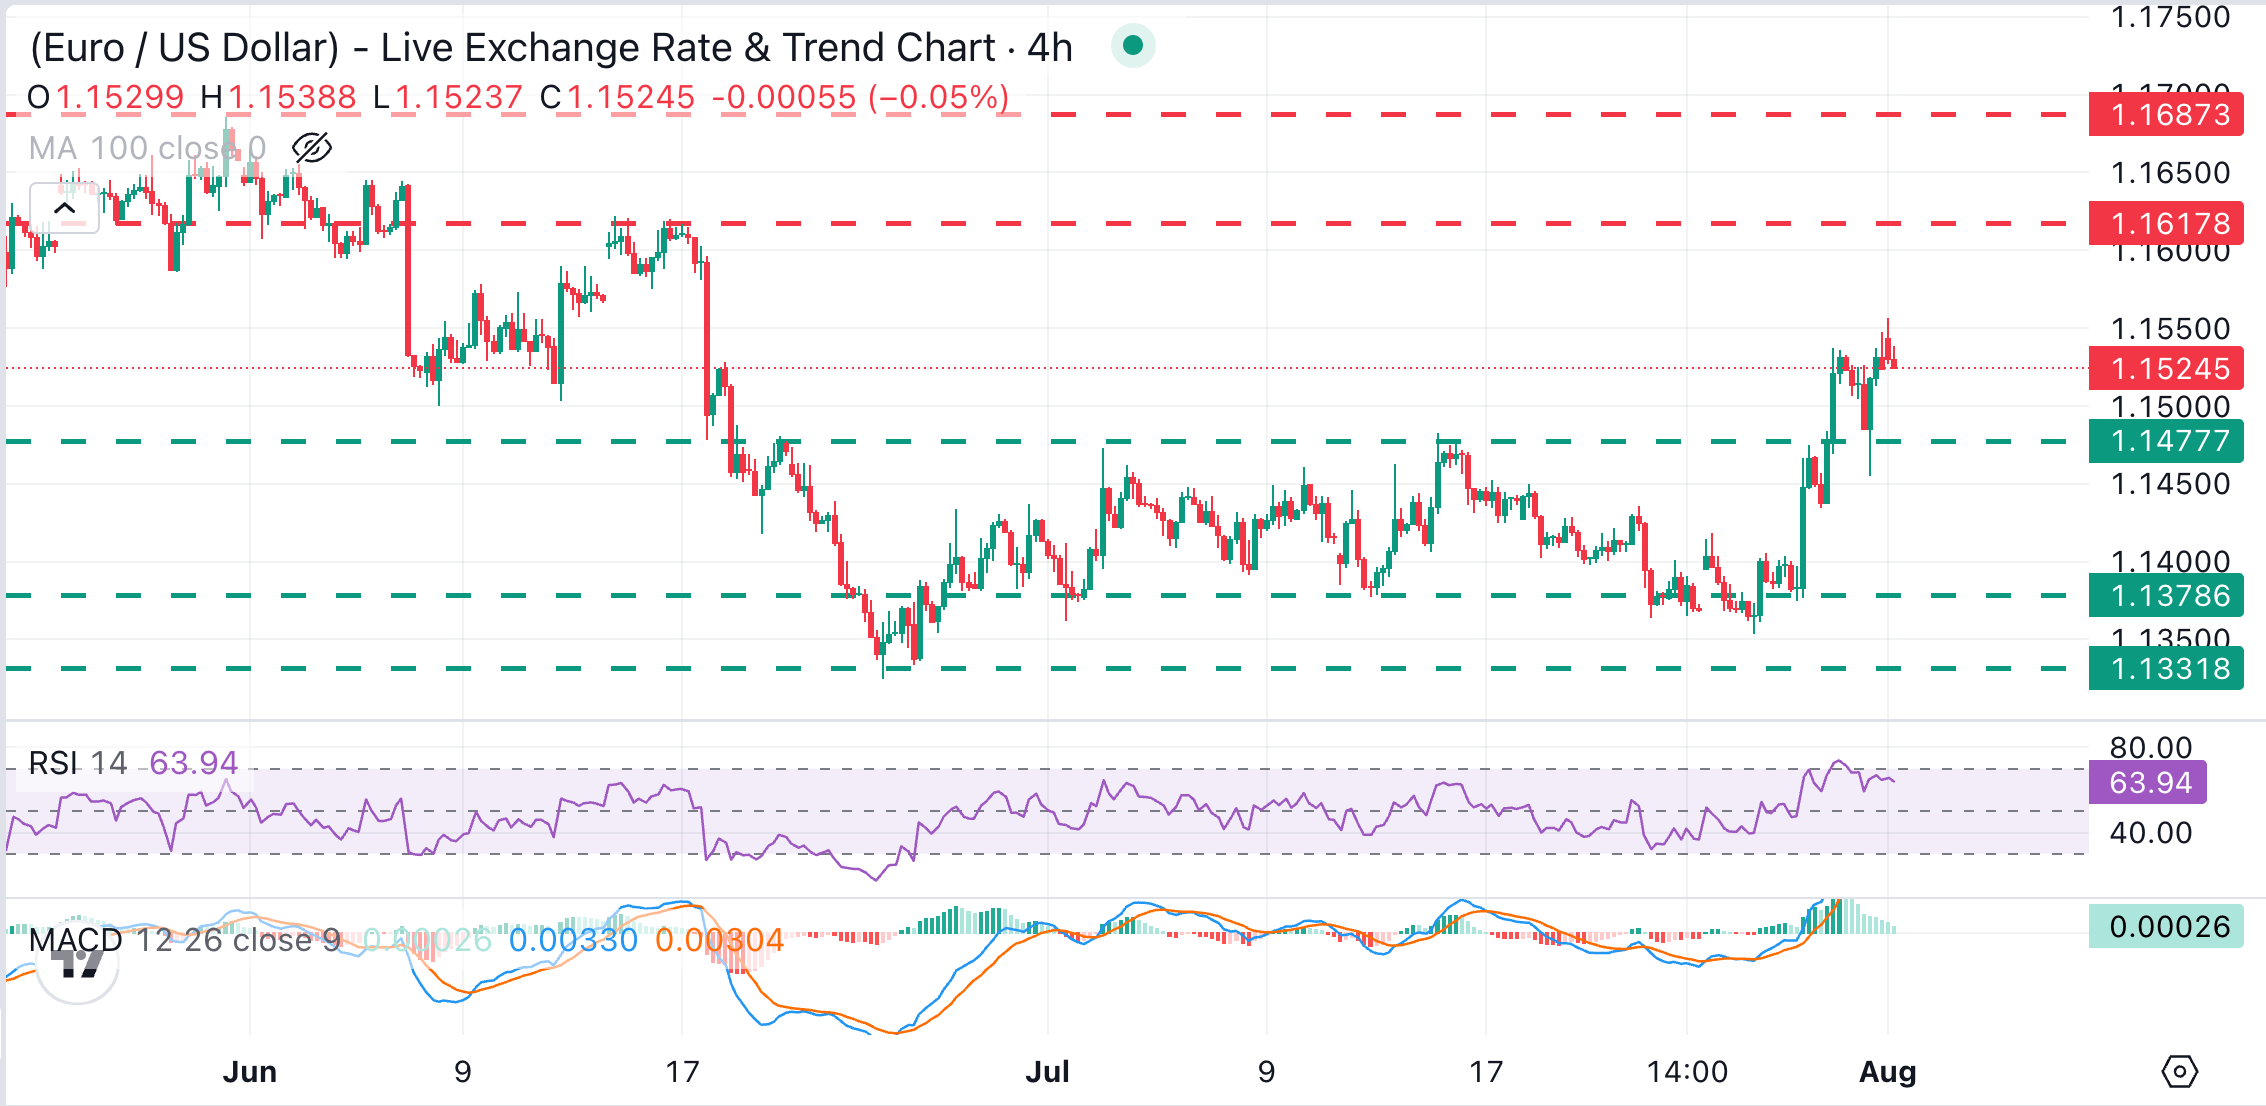
The technical picture shows a modest bullish near-term bias, with the 4-hour Relative Strength Index (14) hovering around 64, showing a positive but not yet overbought momentum, while the Moving Average Convergence Divergence (MACD) indicator remains in positive territory.
Upside attempts have been capped at the 1.1550 area on Monday. Further up, the June 14 and 17 highs, around 1.1620, and the May 29 high, at 1.1685, are likely to test bulls. On the downside, previous resistance around 1.1475 (July 15, 16 highs) has now turned support. If that level gives up, the next targets are the July 29 lows around 1.1375 and the late June lows at 1.1325.
(The technical analysis of this story was written with the help of an AI tool. Know more.)
Fed FAQs
Monetary policy in the US is shaped by the Federal Reserve (Fed). The Fed has two mandates: to achieve price stability and foster full employment. Its primary tool to achieve these goals is by adjusting interest rates. When prices are rising too quickly and inflation is above the Fed’s 2% target, it raises interest rates, increasing borrowing costs throughout the economy. This results in a stronger US Dollar (USD) as it makes the US a more attractive place for international investors to park their money. When inflation falls below 2% or the Unemployment Rate is too high, the Fed may lower interest rates to encourage borrowing, which weighs on the Greenback.
The Federal Reserve (Fed) holds eight policy meetings a year, where the Federal Open Market Committee (FOMC) assesses economic conditions and makes monetary policy decisions. The FOMC is attended by twelve Fed officials – the seven members of the Board of Governors, the president of the Federal Reserve Bank of New York, and four of the remaining eleven regional Reserve Bank presidents, who serve one-year terms on a rotating basis.
In extreme situations, the Federal Reserve may resort to a policy named Quantitative Easing (QE). QE is the process by which the Fed substantially increases the flow of credit in a stuck financial system. It is a non-standard policy measure used during crises or when inflation is extremely low. It was the Fed’s weapon of choice during the Great Financial Crisis in 2008. It involves the Fed printing more Dollars and using them to buy high grade bonds from financial institutions. QE usually weakens the US Dollar.
Quantitative tightening (QT) is the reverse process of QE, whereby the Federal Reserve stops buying bonds from financial institutions and does not reinvest the principal from the bonds it holds maturing, to purchase new bonds. It is usually positive for the value of the US Dollar.
US Dollar FAQs
The US Dollar (USD) is the official currency of the United States of America, and the ‘de facto’ currency of a significant number of other countries where it is found in circulation alongside local notes. It is the most heavily traded currency in the world, accounting for over 88% of all global foreign exchange turnover, or an average of $6.6 trillion in transactions per day, according to data from 2022. Following the second world war, the USD took over from the British Pound as the world’s reserve currency. For most of its history, the US Dollar was backed by Gold, until the Bretton Woods Agreement in 1971 when the Gold Standard went away.
The most important single factor impacting on the value of the US Dollar is monetary policy, which is shaped by the Federal Reserve (Fed). The Fed has two mandates: to achieve price stability (control inflation) and foster full employment. Its primary tool to achieve these two goals is by adjusting interest rates. When prices are rising too quickly and inflation is above the Fed’s 2% target, the Fed will raise rates, which helps the USD value. When inflation falls below 2% or the Unemployment Rate is too high, the Fed may lower interest rates, which weighs on the Greenback.
In extreme situations, the Federal Reserve can also print more Dollars and enact quantitative easing (QE). QE is the process by which the Fed substantially increases the flow of credit in a stuck financial system. It is a non-standard policy measure used when credit has dried up because banks will not lend to each other (out of the fear of counterparty default). It is a last resort when simply lowering interest rates is unlikely to achieve the necessary result. It was the Fed’s weapon of choice to combat the credit crunch that occurred during the Great Financial Crisis in 2008. It involves the Fed printing more Dollars and using them to buy US government bonds predominantly from financial institutions. QE usually leads to a weaker US Dollar.
Quantitative tightening (QT) is the reverse process whereby the Federal Reserve stops buying bonds from financial institutions and does not reinvest the principal from the bonds it holds maturing in new purchases. It is usually positive for the US Dollar.