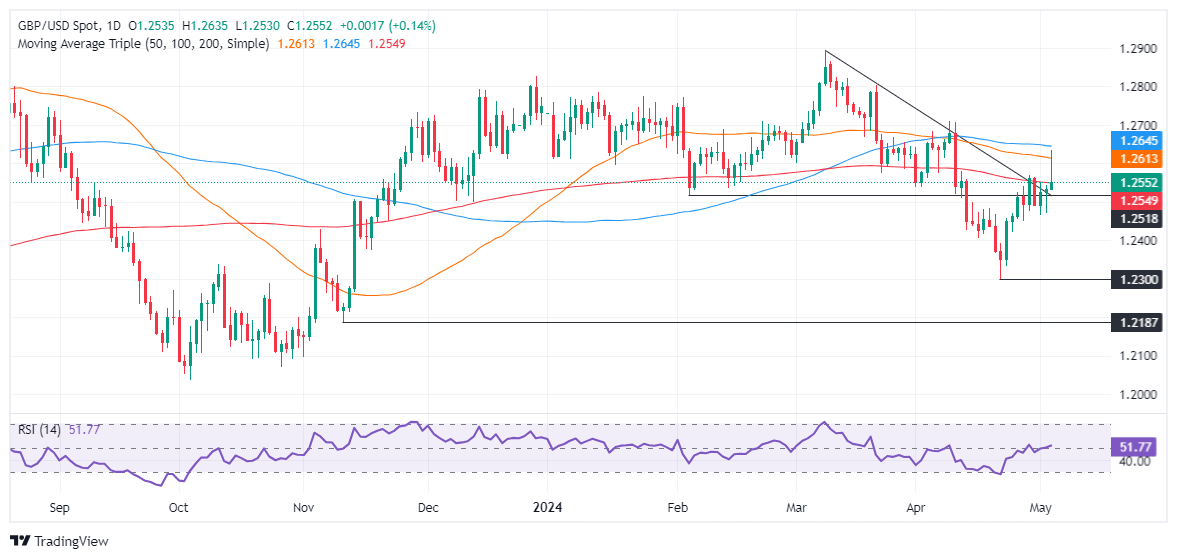
GBP/USD Price Analysis: Bears in charge as ‘shooting star’ looms
- GBP/USD down 0.06% after reaching a three-week high of 1.2634.
- RSI flattening suggests normalization of buying pressure.
- Support levels at 1.2500, 1.2474, and 1.2466; breach may test 1.2400.
- Resistance at 200-DMA, 1.2600, and DMAs at 1.2612 and 1.2644.
The Pound Sterling holds to gains versus the US Dollar yet retraced from three-week highs reached at 1.2634 following a softer than expected US Nonfarm Payrolls report. However, buyers lacked the strength to keep prices above 1.2600, opening the door for a test of the 200-day moving average (DMA). The GBP/USD trades at 1.2541, down by 0.06%.
GBP/USD Price Analysis: Technical outlook
The daily chart suggests the GBP/USD spike that breached the 50 and 100-DMA, reassembling a ‘shooting star’ opened the door for sellers to enter the market and dragged the spot price toward current levels. Even though the Relative Strength Index (RSI) suggests that buyers are in charge, it seems to shift flat, an indication of normalization.
Therefore, as GBP/USD bulls lose steam, that could pave the way for a deeper pullback. The first support seen is 1.2500. A drop below that level would expose the May 2 low at 1.2474, ahead of the latest pivot low at 1.2466. Once those two levels are surpassed, up next would be the 1.2400 psychological level.
Conversely, if buyers moved in, the first resistance would be the 200-DMA at 1.2548. Further upside is seen at 1.2600, followed by the 50 and 100-DMAs, each at 1.2612 and 1.2644, respectively.
GBP/USD Price Action – Daily Chart


